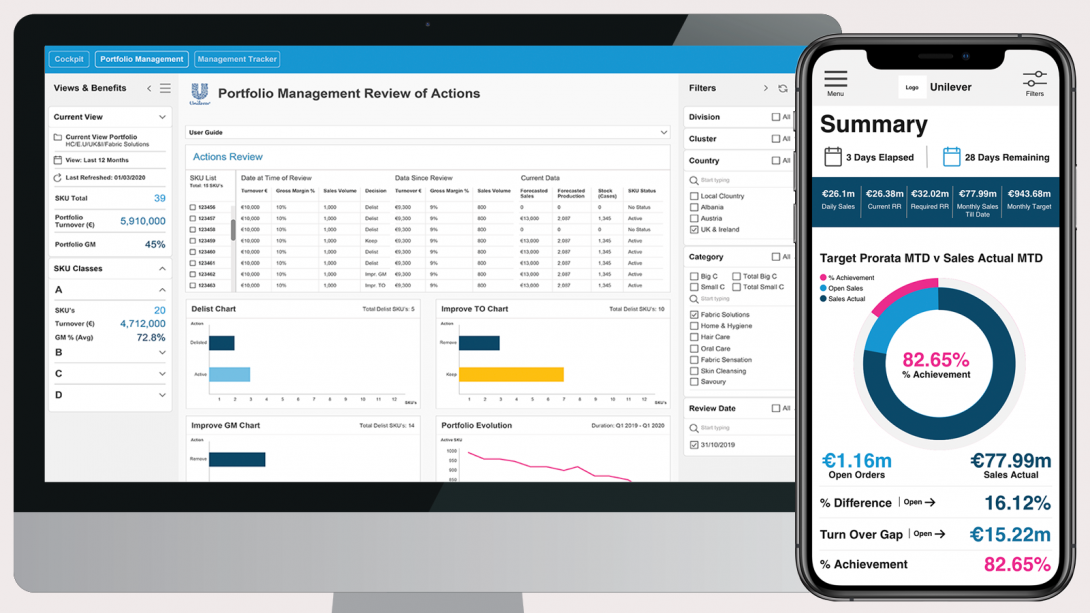
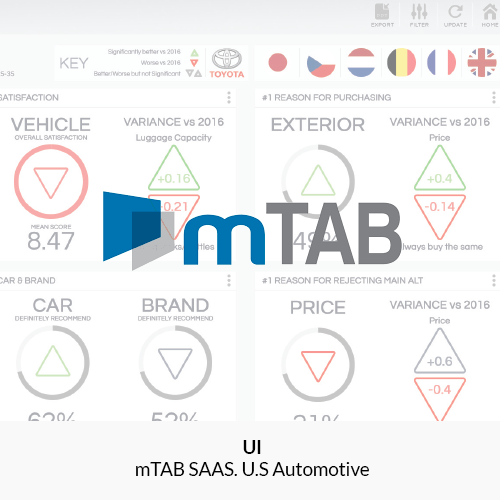
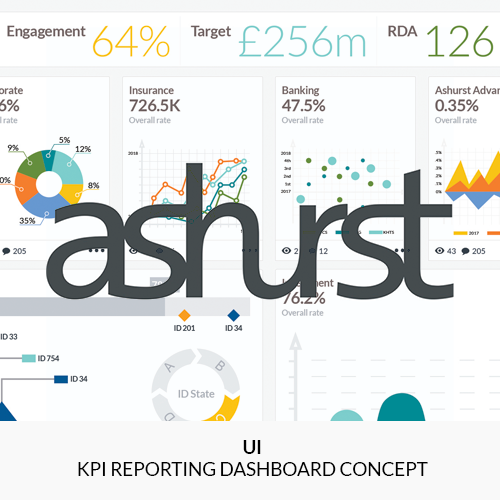
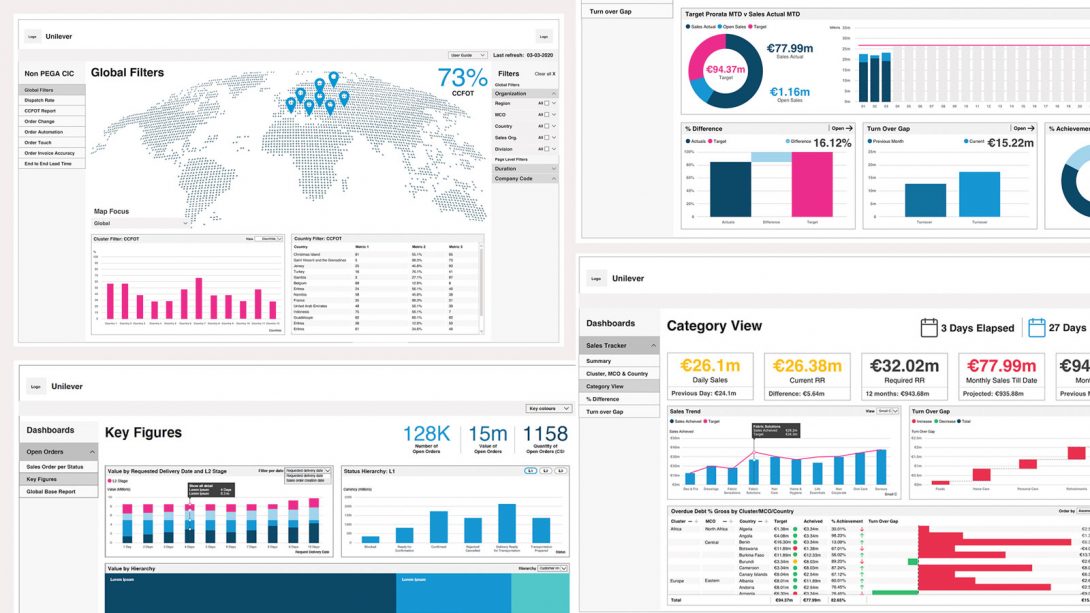
PowerBI dashboards: Global Supply Chain and Portfolio Manager
VALUE5% Reduction in waste for Production and Logistics
10-15% Efficiency increase managing portfolios
OUTCOMES • User-centric reporting tools that helped drive efficiencies, meet targets and KPI‘s across each of business lines in Europe, South East Asia, South America, and North Africa
• Improved the understanding and value of UX for the Digital Solutions Factory who were now responsible for digital products across Unilever
• Aligning over 155,000 end users and the global data lake they feed into, reducing material waste and effort
HOW I HELPED
Mentoring Digital Solutions Factory through each step of the UX process, stakeholder discovery and alignment workshops, remote user research, and analysis. Regular playbacks to Senior Leaders, establishing key user goals, needs, and opportunities across South East Asia, South America, Europe, and North Africa. Defining personas and user journey mapping for each business unit and country to find patterns and edge cases. Wireframes, prototypes, validation/iterations, hi-fidelity UI, development and delivery.
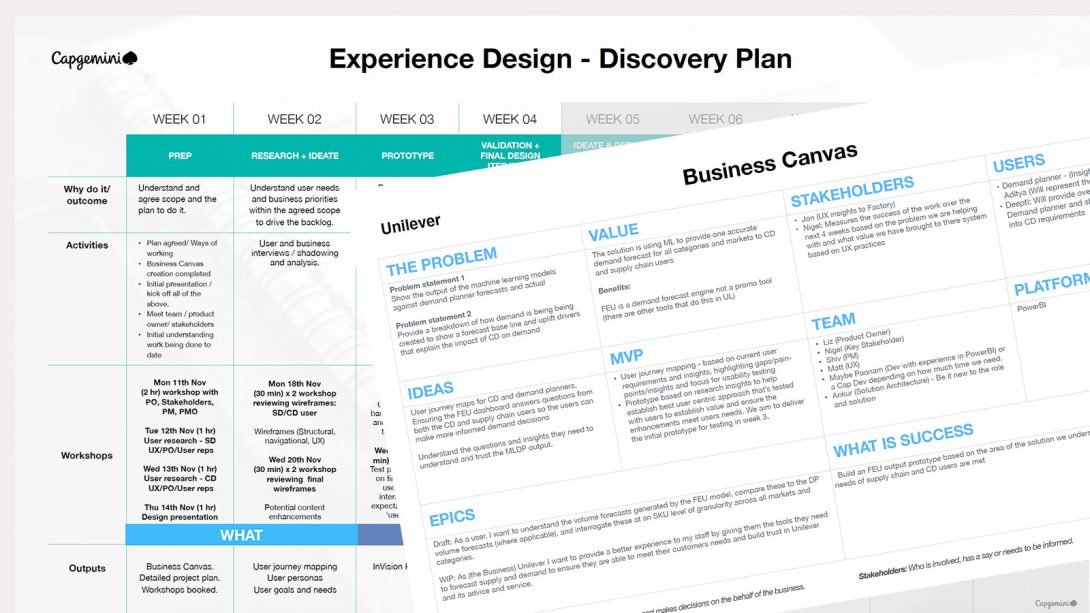
Discovery
Business goals and stakeholder alignment using the Business Canvas and Discovery plan. Roles, responsibilities, milestones, success, and measures are essential, it also gives detail on when and how I will provide the value they need and expect for the project.
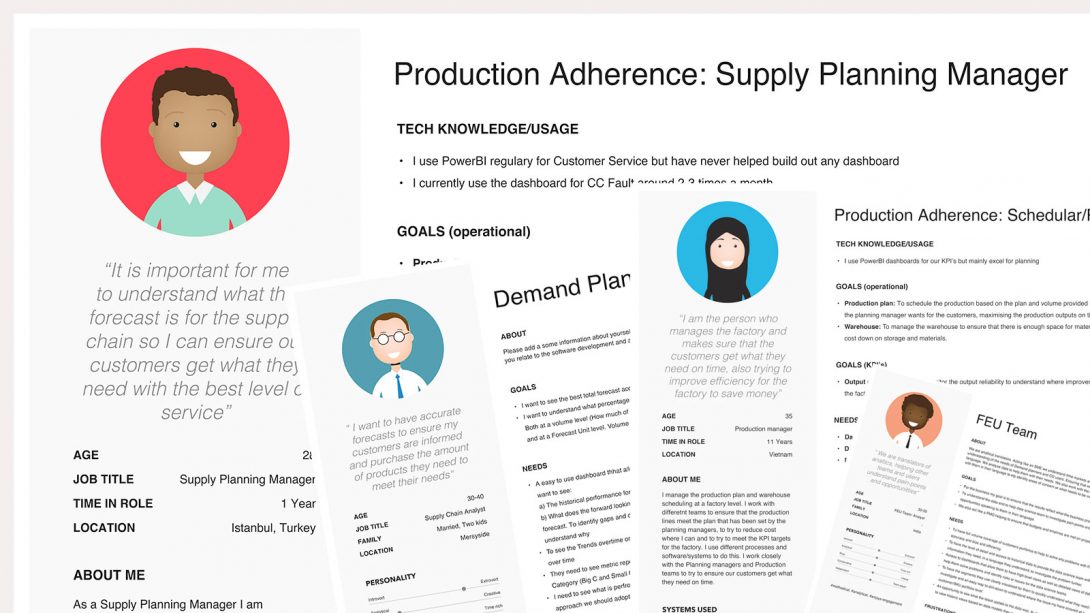
User Research
Remote User Research across Europe, South East Asia, South America, and North Africa with the use of Translators for non-English speakers. Using Microsoft Teams as the tool for remote collaboration, and for recording and translating user interviews. I conducted 40 Interviews across the 5 projects, speaking with Senior Directors in Europe and North Africa, all the way down the business to Factory Night Shift Production Managers in South East Asia and South America.
Establishing user groups for the business, and defining key personas to focus on for each project
System and user journey mapping to help establish pain points, gaps, and potential opportunities to focus on
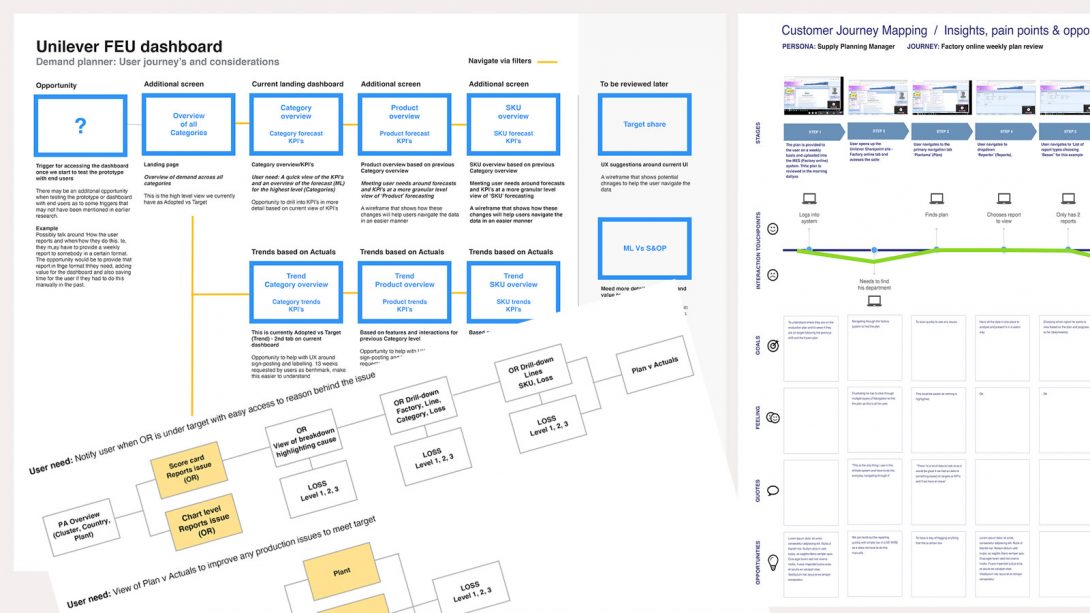
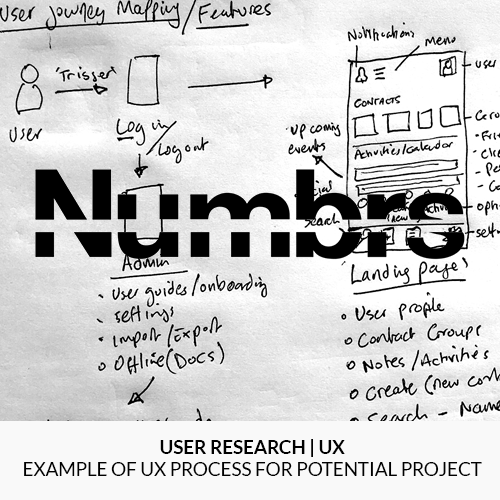
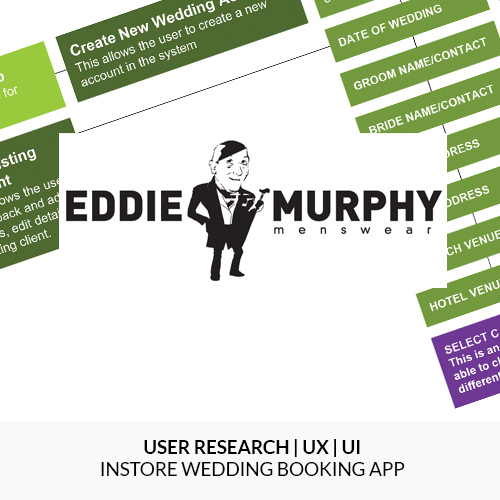
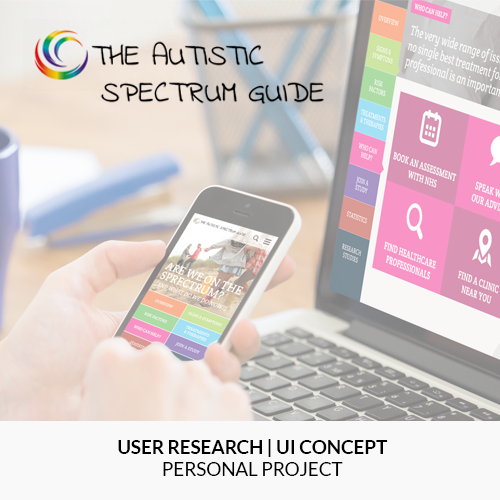
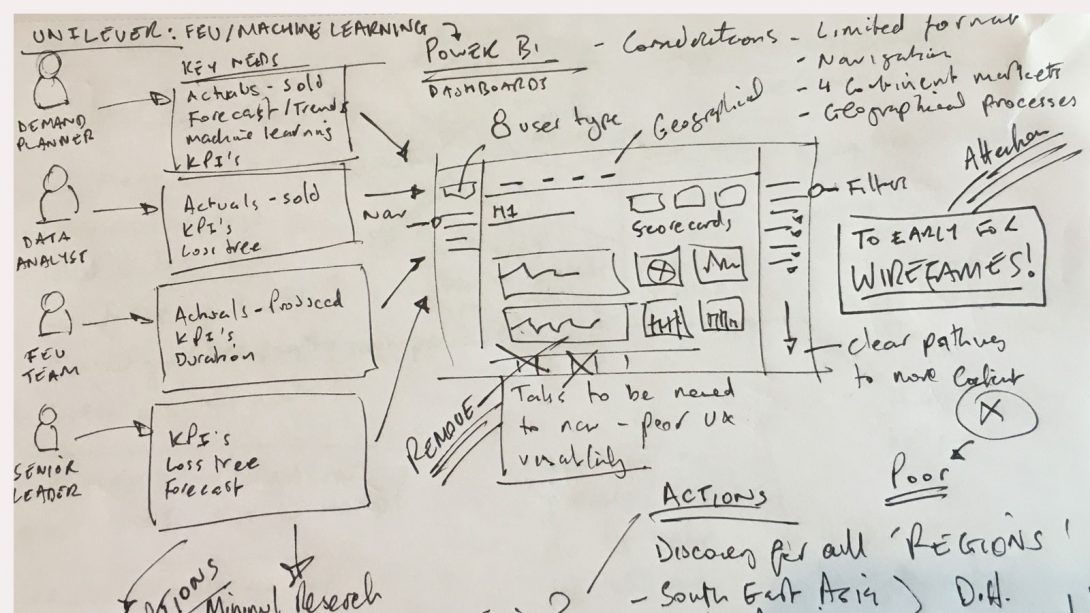
Ideate: Sketches, Wireframes & Prototypes
Working with stakeholders, analysts, developers, and most importantly end users across the globe. I used Pen and paper to ideate and Sketch and Invision to provide interactive prototypes or wireframes to help with the challenges of collaboration across the globe and remote working as a team. Validating the information hierarchy, how the content was displayed, the user interactions, user journeys, and how the end-users would act on these reports. Annotating these dashboards through InVision helped us meet project deadlines.
Sketches
Wireframes
Prototypes